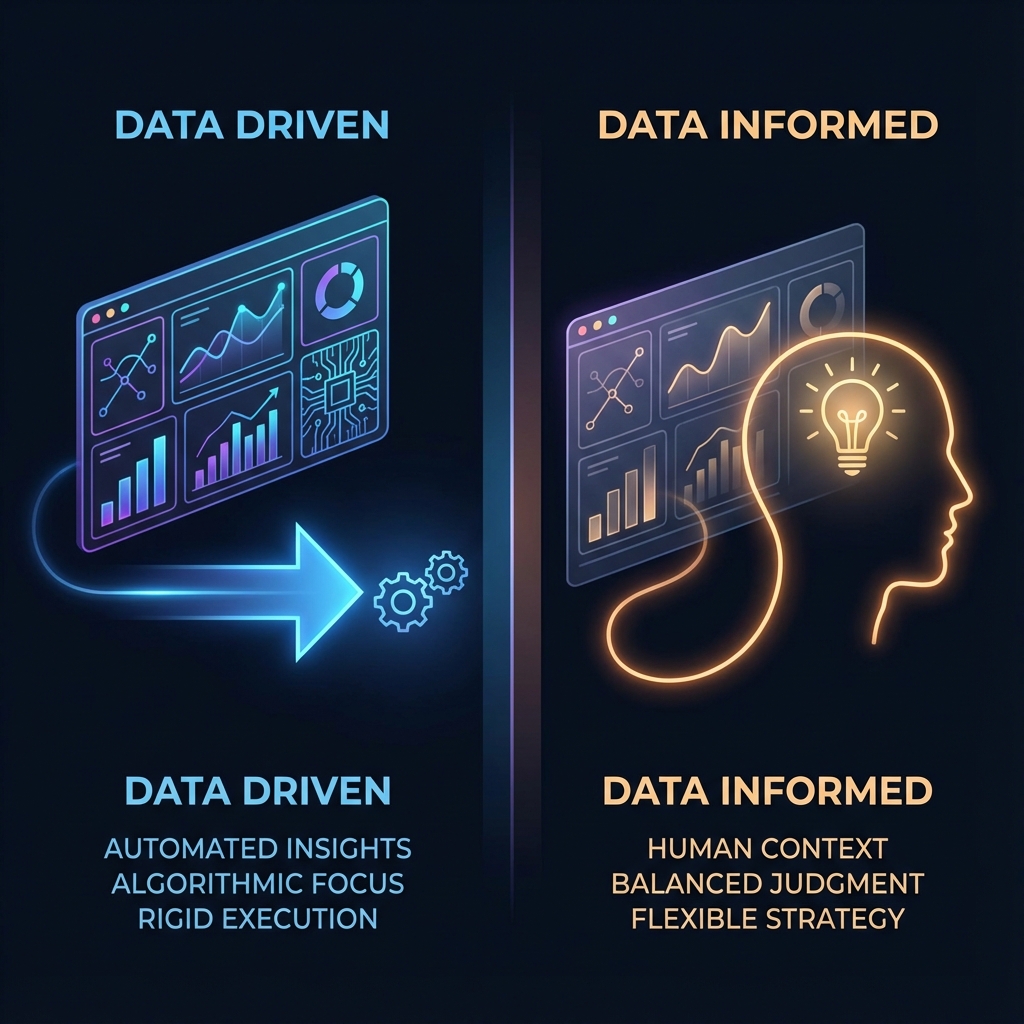
Data Dynamic: Being Data-Informed, Not Data-Driven
Data tells you 'what' happened, but not 'why'. Product intuition helps you ask the right questions to the data. In the age of Big Data, we have become paralyzed by dashboards. The most successful product teams don't just worship data; they interrogate it.
1. The Local Maxima Trap
Scenario: You are testing button colors. Blue converts at 2.0%. Red converts at 2.5%. You ship Red.
You iterate. Dark Red is 2.6%.
You have reached a Local Maximum. You are optimizing a hill when there is a mountain next to you.
Data is excellent at optimization (climbing the hill). It is terrible at innovation (finding the mountain).
No amount of A/B testing would have turned a horse carriage into a car. A/B testing assumes that the optimal solution lies somewhere on the user interface you have already built. It cannot tell you if the interface itself is the problem.
The Limit of Optimization:
Amazon famously A/B tested the color of details on their homepage. 50 shades of blue. They found the perfect blue. This drove millions in revenue.
However, if Amazon had only focused on A/B testing, they would have a very optimized bookstore. They would never have launched AWS or Prime Video. Those required strategic leaps of faith, not statistical significance.
2. The "Why" vs The "What"
We often conflate "Data" with "Quantitative Metrics." But this is a mistake.
Quantitative Data (The What): Dashboards, Mixpanel, Google Analytics.
Strengths: Scale, accuracy, trends.
Weaknesses: Tells you nothing about intent or emotion.
Qualitative Data (The Why): User interviews, support tickets, session replays.
Strengths: Nuance, intent, "aha" moments.
Weaknesses: Low sample size, bias, hard to index.
The Synergy:
Use Quant to find the problem ("Drop-off is high on step 3").
Use Qual to find the cause ("Users think the 'Submit' button commits them to paying").
Use Quant to verify the fix ("Did changing the button text reduce drop-off?").
3. Data as a Flashlight, Not a GPS
We often treat data as a GPS: "Turn left in 100 meters." We abdicate responsibility to the numbers.
Data Driven: "The GPS says turn right into the lake, so I will." (Following metrics blindly).
Data Informed: "The GPS says turn right, but I see a lake, so I will ignore it." (Using data as one input among many).
You must balance Quantitative Data with Qualitative Data and Strategic Intuition (Market trends, company vision).
The Decision Matrix
How do you weigh these inputs?
1. Low Risk, Low Ambiguity (e.g., Button Color): Be Data Driven. Let the A/B test decide. Why argue over opinions when you can measure facts?
2. High Risk, Low Ambiguity (e.g., Server Migration): Be Engineering Driven. Trust technical expertise.
3. High Risk, High Ambiguity (e.g., New Product Launch): Be Insight Driven. Data can't guide you here because it doesn't exist yet. This is where founder intuition (or "Product Sense") is critical.
4. Goodhart's Law & The Cobra Effect
"When a measure becomes a target, it ceases to be a good measure." - Goodhart's Law.
In British India, the government offered a bounty for every dead cobra to reduce the cobra population. Result? People started breeding cobras to kill them for the bounty. When the government stopped the program, breeders released the cobras, making the problem worse.
In Product:
If you incentivize "Daily Active Users" (DAU), your team might send spammy push notifications to get numbers up. The metric goes up, but user trust goes down (churn increases later).
If you incentivize "Velocity" (Story points per sprint), the team will inflate the estimates. A 3-point story becomes an 8-point story. Velocity doubles, output stays the same.
If you incentivize "Zero Bugs," the QA team might stop reporting edge cases.
Counter-metrics: Always pair a growth metric with a quality metric (The "Guardrail").
Example: If you track "Signups" (Growth), also track "Activation Rate" or "Retention" (Quality). If Signups go up but Retention goes down, you are just burning through your total addressable market.
5. The Hierarchy of Metrics
Not all data is equal. You need a structure to avoid drowning in charts.
North Star Metric (NSM)
The single metric that best captures the value your product delivers to its customers. It aligns revenue with customer success.
Spotify: Time spent listening (Value = Enjoyment). Not "App Opens."
Airbnb: Nights Booked (Value = Travel). Not "Searches."
Facebook: Daily Active Users (Value = Connection? Debatable, but that's their choice).
Input Metrics (Levers)
You can't move the North Star directly. You move the inputs.
Spotify Example:
Input 1: Breadth: Number of songs in catalog.
Input 2: Depth: Accuracy of recommendation algorithm (% of skips).
Input 3: Frequency: Latency of playback start (Speed leads to more sessions).
Focus your team's efforts on the Inputs. If the inputs improve, the North Star should move. If it doesn't, your hypothesis relating inputs to outputs is wrong.
6. Case Study: Facebook's "7 Friends in 10 Days"
This is the holy grail of "Data Informed" growth.
In existing FB data, they looked for a correlation between user behavior and long-term retention.
They found that users who added 7 friends in their first 10 days were substantially more likely to remain active users for life.
Action: They didn't just "watch" this metric. They re-architected the entire onboarding flow to prioritize friend finding. "Import Contacts" became the primary call to action. Profile pictures were secondary.
Lesson: Data found the lever (7 friends). Product design pulled the lever.
7. Case Study: Netflix's Artwork Personalization
Netflix doesn't just recommend movies; they recommend how the movie is presented to you.
If your watch history is full of Romance movies, the thumbnail for "Good Will Hunting" will show Matt Damon and Minnie Driver kissing.
If your watch history is full of Comedy, the thumbnail will show Robin Williams smiling.
The Insight: The "product" is the same (the movie file), but the "packaging" is dynamic based on user data. This is data-driven personalization at its peak.
8. The Airbnb Example (The $200 Lesson)
In 2009, Airbnb was failing. They were booking $200/week (total revenue, not profit). They were close to bankruptcy.
The data said: "People are clicking, but not booking."
A "Data Driven" PM would A/B test the "Book" button color, or change the copy, or reduce the price. They would iterate on the landing page.
The Founders (Joe Gebbia and Brian Chesky) did something unscalable. They flew to New York to meet their hosts. They realized the photos were terrible. It was dark, blurry phone photos.
The Non-Data Solution: They rented a $5,000 camera and went door-to-door taking high-res photos of the apartments.
The Result: Revenue doubled in a week.
Data could never have told them to "buy a camera." It told them where the problem was (conversion), but not what the solution was. Good product work requires stepping outside the dashboard and into the user's reality.
9. How to Argue with Data
When someone says "The data says X," ask these questions:
- "What is the sample size?" (Is this 5 users or 5,000? Small samples fluctuate wildly).
- "What is the cohort?" (Are these power users or new users? New users behave very differently).
- "Is this statistical significance or just noise?" (A 2% lift with a p-value of 0.2 is meaningless).
- "What else changed?" (Did we run a marketing campaign on the same day? Was it a holiday? Seasonality confounds everything).
- "Is the data clean?" (Tracking bugs are more common than user behavior changes).
Conclusion
Be skeptical of metrics. Use them to validate your intuition, not replace it. If the chart goes up but the user complains, believe the user. If the chart goes down but the user is happy, check your tracking code.
Great products are built by people who have empathy, taste, and vision—informed by data, but not ruled by it. The best Product Managers are bilingual: they speak the language of human emotion and the language of statistical significance.